
Wednesday, October 30, 2013
Current up-trend target: SPY 180.1, by 12 November, 2013
My indicators point to the following price/time target: SPY 180.1 (or vicinity), by 12 November 2013 (if today's current opening range low at 177, or vicinity, is not violated).

Thursday, August 15, 2013
Should the dice roll...

Should the dice roll, I have a price/time window target for SPY (red rectangle bottom right).
Saturday, August 3, 2013
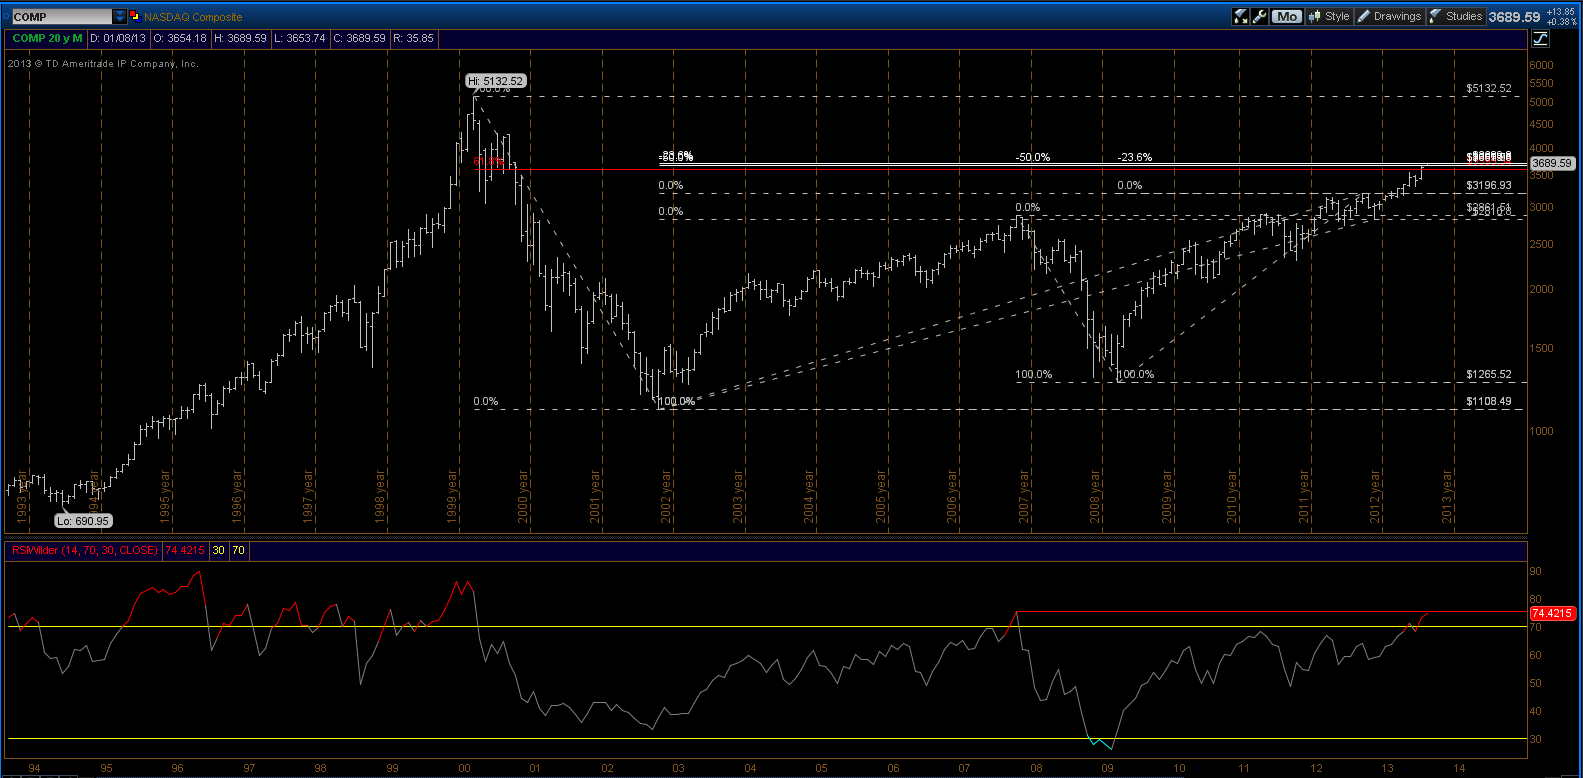
Nasdaq Composite - Multi-year bearish set-up
Major market turns have in the past happened in the oblivious state of summer heats:
August 1921
July 1932
June 1949
August 1982
The Nasdaq Composite chart below, or better, the way I look at it, suggests to me that there is a distinct bearish scenario that has reached or it's about to reach its multi-year gestation.
Saturday, July 13, 2013
Burn It Down (lyrics)
The cycle repeated
As explosions broke in the sky
All that I needed
Was the one thing I couldn't find
And you were there at the turn
Waiting to let me know
We're building it up
To break it back down
We're building it up
To burn it down
We can't wait
To burn it to the ground
The colors conflicted
As the flames climbed into the clouds
I wanted to fix this
But couldn't stop from tearing it down
And you were there at the turn
Caught in the burning glow
And I was there at the turn
Waiting to let you know
We're building it up
To break it back down
We're building it up
To burn it down
We can't wait
To burn it to the ground
You told me, "Yes"
You held me high
And I believed when you told that lie
I played soldier, you played king
And struck me down, when I kissed that ring
You lost that right, to hold that crown
I built you up, but you let me down
So when you fall, I'll take my turn
And fan the flames
As your blazes burn
And you were there at the turn
Waiting to let me know
We're building it up
To break it back down
We're building it up
To burn it down
We can't wait
To burn it to the ground
When you fall, I'll take my turn
And fan the flames
As your blazes burn
We can't wait
To burn it to the ground
When you fall, I'll take my turn
And fan the flames
As your blazes burn
We can't wait
To burn it to the ground
Thursday, May 9, 2013
The market growing taller and walking the same proportionate distance

The way I drew this chart is as follows:
I have used as base anchor point the low of 03/06/2009 and I have used as ending anchor points, the 3 subsequent low points of the starting weeks of 2010, 2011, 2012 and 2013.
Then I have projected these 4 segments by a 23.6% factor (fib number).
The result is to me interesting: in each of the years 2010, 2011 and 2012, the market reached this -23% fib extension by end of April/beginning of May and then retraced at least to the area where it was at the very beginning of the year (2011 and 2012, in particular, had approximately the same low the first week of the year).
By the same proportions, in 2013 the -23.6% fib extension target was very marginally pierced yesterday.
A word or two of caution here are needed: firstly, previous instances pierced the -23.6% fib level by as much approximately 2 SPY points (which if you trade in large amounts or with leverage can be painful to bear); secondly, unfortunately the 2013 fib level we have just reached is right above the previous 2007 market all-time high. This to me tells that there is potentially more shorts squeeze fuel to propel the market higher at this juncture compared to previous ones; thirdly, once a pattern is a pattern and becomes evident, it usually morphs into something else.
I have tried to lucubrate why this pattern seemed to be repeating and one hypothesis I came up with is that the liquidity injected into the system by the FED since 2008/2009 (which cumulatively is growing bigger each year), has the power to extend the market by a proportionate amount each here. In other words, it is like a man growing taller each year and being able to walk with one step a longer distance each year, but the length of his steps, although longer each year, is a constant proportion to his height.
If you have other plausible explanations, please share them here with me.
Friday, May 3, 2013

Tuesday, April 2, 2013

Friday, February 8, 2013

Sunday, February 3, 2013

Friday, February 1, 2013
Dow Jones Industrial Average Long-term pivot
Dow Jones Industrial Average Long-term pivot

Close-up 2007

Close-up 2013


Close-up 2007

Close-up 2013

Thursday, January 31, 2013
Update on US indeces macro proportions
Albeit circumspect, reaction at upper wedge-like trend-line on SPX and DJI + 61.8% large multi-week fib extension on SPX (to the tick!), while NDX did not break out, allows to keep last post' stance (R2K break above 2007 top and trend-line is of concern).
Updated charts below.
NDX Monthly

NDX Daily

SPX Monthly

SPX Daily

DJI Monthly

DJI Daily

R2K Monthly

R2K Daily

Updated charts below.
NDX Monthly

NDX Daily

SPX Monthly

SPX Daily

DJI Monthly

DJI Daily

R2K Monthly

R2K Daily

Friday, January 18, 2013
Proportions for a possible important top
Dear Reader,
After a long communication breakdown, I resume posting today because I would like to share with you one potentially important finding of a review of markets after today's close.
My analysis suggests that today an important top might have been put in place across the 4 major US indices (Nasdaq100, S&P500, Dow Jones Industrial Average and Russell 2000).
This post could be lost among the millions attempts to predict a major turning point, but I felt it was worth sharing it this time.
Below I insert snapshots of what the markets look like to my eye tonight.
NDX Monthly

NDX Daily

SPX Monthly

SPX Daily

DJI Monthly

DJI Daily

R2K Monthly

R2K Daily

Subscribe to:
Posts (Atom)